
Each Artisan input channel can be intercepted by a symbolic formula before its data is forwarded to the corresponding curve. Symbolic formulas allow to change data retrieved from the input source before it is further processed, displayed and stored in the internal data structures. In that respect, the use of symbolic formulas is usually destructive to the original data received. From Artisan v2.1 on, symbolic formulas can also be applied to the two rate-of-rise channels.
In this post we recap the basics of Artisan's symbolic formula mechanism, describe the new variables that have been added in Artisan v2.1 and explain their interplay by discussing useful applications.
Symbolic formulas have been introduced back in 2011 for Artisan v0.5. Previous posts on this mechanism are
- Virtual Devices and Symbolic Assignments (4/2014)
- Signals, Symbolic Assignments and the Plotter (10/2015)
- Natural Roasts (10/2015)
- Roast Calculus (3/2016)
NOTE: all symbolic variables are case sensitive!
1. Basic Mechanism
A symbolic formula can be closed like the constant formula "10" (all formulas are given here with leading and trailing double quotes for readability only. Those quotes are not part of the formula and should not be keyed in) which always evaluates to the same value 10 independent of any sampled data, or "open" and refer to the channels actual or previous data or even other channels data and certain system states. An example of an open symbolic formula is "x + 10" that refers to the actual reading x and adds a constant offset of 10 to each reading, shifting the curve up by 10. Besides simple arithmetic functions like the addition in the example above, many other mathematical functions, like abs(x), min(x,y), sin(x), exp(x),..., can be used in formulas (see below).
Symbolic formulas are evaluated in device order. Extra device formulas, before the main device formulas. Thus formulas calculated later in that order will have access only to the results of previous formulas.
The value -1 is treated as error value. If any symbolic variable of a formula evaluates to the error value -1 the whole formula evaluates to -1 (with only a few exceptions for technical reasons). Note that intermediate -1 error values are not drawn as the interpolation mechanism of Artisan will instead connect the last non-error reading with the next non-error reading with a straight line.
The following symbols are supported.
MATHEMATICAL CONSTANTS
e : 2.718281828459045
pi : 3.141592653589793
MATHEMATICAL FORMULAS
abs(x) : Return the absolute value of x.
acos(x) : Return the arc cosine (measured in radians) of x.
asin(x) : Return the arc sine (measured in radians) of x.
atan(x) : Return the arc tangent (measured in radians) of x.
cos(x) : Return the cosine of x (measured in radians).
degrees(x) : Convert angle x from radians to degrees.
exp(x) : Return e raised to the power of x.
log(x,[base]) : Return the logarithm of x to the given base.
min(x1,..,xn) : Return the minimum of the given values.
max(x1,..,xn) : Return the maximum of the given values.
pow(x,y) : Return x**y (x to the power of y).
radians(x): Convert angle x from degrees to radians.
sin(x): Return the sine of x (measured in radians).
sqrt(x) : Return the square root of x.
tan(x) : Return the tangent of x (measured in radians).
EXPRESSIONS
(<true-expr> if <cond> else <false-expr>) : Conditional. Evaluates to the value of the expression <true-expr> if the condition <cond> holds, otherwise to the value of the expression <false-expr>. The rules of Python are applied to decide if a value holds or not. Thus the boolean values "True" and "False" have the obvious semantic. Any number unequal to 0 evaluates to True and 0 evaluates to False. The value "None" is also evaluated to False.
SYMBOLIC VARIABLES
t : Absolute time (seconds) from begin of recording (not only the time after CHARGE!)
b : Absolute time (seconds) from begin of recording of the background profile
x : Current channel reading (not available in the Plotter)
Y1 : ET value
Y2 : BT value
Y3 : Extra Device #1 T1 value
Y4 : Extra Device #1 T2 value
Y5 : Extra Device #2 T1 value
Y6 : Extra Device #2 T2 value
..
B1 : ET background
B2 : BT background
B3 : Extra background #1-A
B4 : Extra background #1-B
B5 : Extra background #2-A
..
T1 : ET tare value
T2 : BT tare value
T3 : Extra Device #1 channel 1 tare value
T4 : Extra Device #1 channel 2 tare value
..
E1 : Last event value of the first event type
E2 : Last event value of the second event type
E3 : Last event value of the third event type
E4 : Last event value of the fourth event type
AXIS MAPPING
k : Scaling factor from time to RoR axis. The range of the temperature scale divided by the range of the delta scale.
o : Offset from time to RoR axis.
Note: RoR values r can be scaled to the temperature axis using a linear approximation of the form "r*k + o". As the variables k and o depend on the actual axis settings which can be changed by the user without triggering a recomputation, those variable are less useful for use in a recording, but useful in the Plotter to plot w.r.t. the RoR x-axis instead of the temperature x-axis.
PLOTTER EXTENSIONS
Using math formulas in the plotter also allows to use the symbolic variables P and F (see Signals, Symbolic Assignments and the Plotter).
P1,..,P9 : The variables P1,..,P9 represent the results from plot #1,..,#9. You can perform calculations in a later plot on variables of an earlier plot. That way, the plot variables P1,..,P9 allow the cascading or intermediate results. For example, plot #3 can refer to the results of plot 1 using the variable P1.
F1,..,F9 : F1 refers to the previous result of the actual formula to realize a feedback loop. This is useful in filter designs. Similarly, F2 refers to the second previous result etc.
SHIFTED SYMBOLIC VARIABLES
The symbolic variables t, b, Y<n>, B<n> and R<n> evaluate to the current value of a sequence of values that define a roast profile. To access earlier or later values one can apply a shift value.
For example, while "Y2" returns the current bean temperature (BT), "Y2[-1]" returns the previous BT temperature and "Y2[-2]" the one before that. Formulas used in the Plotter are applied in sequence to all values, thus there "Y2" points to the current BT temperature processed, "Y2[-1]" the previous BT temperature processed and "Y2[+1]" the next BT temperature to be processed. A positive shift is only available in the Plotter, obviously not during recording.
2. NEW VARIABLES
In Artisan v2.1 additional symbolic variables were introduced to access the computed rate-of-rise values, event indices, time distances from events, the area-under-the-curve (AUC) parameters and value, the computed predictions and the indexed data access.
RATE OF RISE
R1 : ET rate of rise
R2 : BT rate of rise
and
RB1 : background ET rate of rise (added in Artisan v2.4)
RB2 : background BT rate of rise (added in Artisan v2.4)
Note: R1 and R2 are only set after CHARGE and RB1 and RB2 only if the background profile is loaded.
EVENT INDEX
CHARGE, DRY, FCs, FCe, SCs, SCe, DROP : Index of the corresponding event of the profile to retrieve time and values from the corresponding data structures. Evaluates to -1 if not set.
bCHARGE, bDRY, bFCs, bFCe, bSCs, bSCe, bDROP : Index of the corresponding event of the background profile to retrieve time and values from the corresponding data structures. Evaluates to -1 if not set.
TIME DELTA
dCHARGE, dDRY, dFCs, dFCe, dSCs, dSCe, dDROP : Time distance in seconds after the corresponding event. Thus dCHARGE is bound to the current roast time (after CHARGE) in seconds while t is bound to the time in seconds from the start of the recording.
AREA UNDER THE CURVE (AUC)
AUCbase : AUC base temperature (could be from the selected event, if set)
AUCtarget : AUC target value (could be from the background profile, if set)
AUCvalue : the current AUC value. -1 if none available.
AREA UNDER THE CURVE (AUC)
PREDICTIONS
pDRY : Prediction of the time distance to the DRY event based on the current RoR. Evaluates to -1 on negative RoR and to 0 if the DRY event is already set.
pFCs : Same as pDRY, just for the FCs event.
Note: The same rules as for the corresponding PhasesLCDs apply to pDRY and pFCs:
- If there is no background profile the DRY or FCs bean temperature used for the prediction is taken from the Config>Phases setup.
- If there is a background profile and there is DRY or FCs event in the background profile, the DRY or FCs bean temperature used for the prediction is taken from the background profile.
- Exception to the above for DRY only: if AutoDRY is checked the DRY temperature used for the prediction is taken from the Config>Phases setup. This does not apply to FCs and AutoFCS.
- The prediction value is the calculated time in seconds to reach the DRY or FCs temperature.
INDEXED SYMBOLIC VARIABLES
Previously recorded data assigned to the symbolic variables t, b, Y<n>, B<n> and R<n> can also directly accessed by index. "Y2{0}" evaluates to the first recorded bean temperature (BT) and "Y2{CHARGE}" to the bean temperature at CHARGE. Additionally, the symbolic variable b can be used to access the recording time at a certain index of the background profile. Thus "b{CHARGE}" returns the recording time at CHARGE of the background profile.
3. Applications
3.1 Getting Started
Depending on your probes installation, your bean temperature (BT) probe on one machine might read just 191C at first crack, while your other machine reads already 198C at that point. By putting the symbolic formula "x + 7" (without quotes) into the "BT Y(x)" field of the Device Assignment dialog (menu Config >> Device, Symb ET/BT tab) of your first machine will apply a constant offset of 7C to each BT reading (which is bound to the symbolic variable "x") to fix this.

∆ ET / BT
Sometimes it is of interest to observe the difference between the driving environmental temperature (ET) and the following bean temperature (BT) over a roast. Why not add a an extra curve that visualizes this difference. Just add an extra device of type "Virtual Device" in the Device Assignment dialog (menu Config >> Devices) under the, 2nd tab "Extra Devices". Adding a device will add two extra curves. We put the symbolic formula "Y1 - Y2" into the y1(x) field to record the difference between ET (bound to the symbolic variable Y1) and the BT (bound to the symbolic variable Y2).

∆ BT / Background BT
Let's add also an additional LCD that reports the temperature difference between the current bean temperature (BT) and that of the loaded background template. We can use the second channel of the extra device added in the previous paragraph and put the symbolic formula "Y2 - B2" in the y2(x) field and hide the corresponding curve, but keep the corresponding LCD visible. That LCD will report a positive temperature offset if our current BT is higher than that of the background template and a negative offset if it is lower and we have to catch up.

One in Two
Artisan assumes that each attached device provides data on at least two channels. How about those one-channel devices like the Phidget VINT TMP1200 1xRTD or the Yocto-IR?
Using one of those one-channel devices as main device is no problem. The actual data will be available at the first channel as bean temperature (BT) and the second channel, available as ET, either reports the same reading, or the internal temperature of the device if available like on IR modules.

What if one wants to also log the environmental temperature using a second one-channel device?
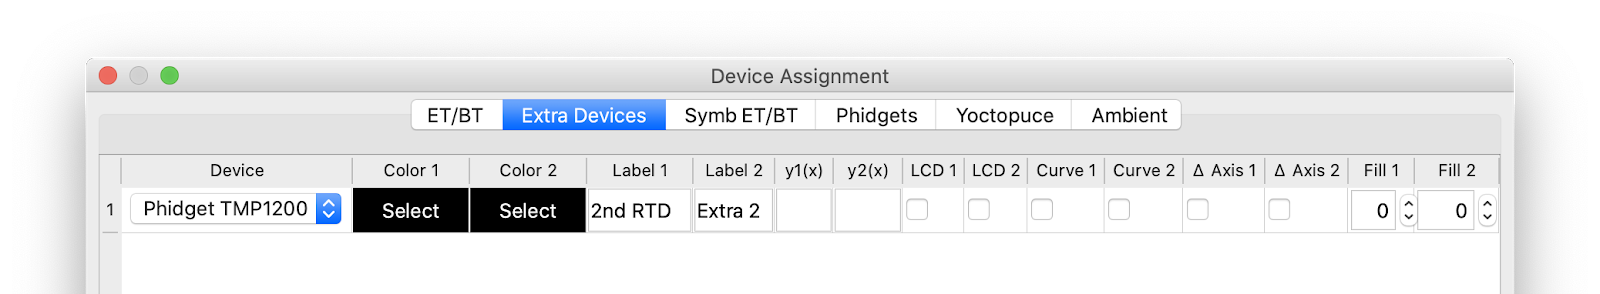
Just add an extra device of the corresponding type (here Phidget TMP1200), hiding its curves and lcds, and map its data back to the ET channel by adding "Y3" (first channel of the first extra device) as symbolic formula for the ET channel under "ET Y(x)" (menu Config >> Device, 3rd tab "Symb ET/BT").

Rate-of-Rise in C/30sec or F/15sec
The Rate-of-Rise (RoR) of a temperature curve is defined as the first derivative of a temperature curve over time. Thus the unit of RoR signals is by definition the temperature unit over time (C/min or F/min). Interestingly, some prefer some wired RoR "units" (which are in the strict sense not proper units), like C/30sec or F/15sec. Artisan does not allow the use of such "interesting" units, but one can easily use a symbolic function to adjust the RoR values by putting it into the the corresponding "Rate of Rise Symbolic Assignment" field (menu Config >> Curves, first tab RoR). Dividing the computed RoR values by 2 using the symbolic formula "x/2" results in readings showing temperature changes per 30sec and dividing them by 4 using the symbolic formula "x/4" results in readings showing the temperature changes per 15sec.

Background Profile Development Ratio %
To see a background curve's DTR in an LCD while Artisan is ON or recording create a Virtual Device with this equation
(100 * (b{DROP}-b{FCs}) / (b{DROP}-b{CHARGE}) if b{FCs} !=-1 else 0)

3.2 Computing Rate-of-Rise (RoR)
Computing the RoR of a curve using symbolic formulas was discussed already in the post Signals, Symbolic Assignments and the Plotter. This can be used to draw a second BT RoR curve in addition to the default one generated by Artisan for example to see the BT RoR at different smoothing levels at the same time. This can also be used to draw the RoR of extra device curves for which Artisan is not providing RoR curves directly. One can also use this possibility to experiment with custom smoothing algorithms.
In Artisan, the rate of change of a profile is mathematically speaking the derivative of the signal Y with respect to the signal t. Let's focus here on the BT RoR thus our signal of interest (BT) is bound to Y2. We have
dY/dt = ((Y2 - Y2[-1]) / (t - t[-1])) * 60
Note that the multiplication by the factor 60 in the formula above just shifts the result unit from C/sec to C/min assuming the underlying temperature channel is in C. In case you like to use freaky units you can also multiply by 30 instead to get the readings in C/30s.

Note that here the ∆Axis flag (new in Artisan v2.1!) is ticked for both virtual device curves as they have to be rendered w.r.t. the ∆ axis and not the standard temperature axis as their unit of measurement is C/min and not C.

The delta span corresponds here to the sampling interval as we compute the RoR directly from succeeding readings. Our additional RoR curve can be smoothed more by increasing its delta span to span two sampling intervals, using the following formula.
dY2/dt = ((Y2 - Y2[-2]) / (t - t[-2])) * 60
3.3 Identifying Flicks
The RoR tells us the speed of the temperature increase of the underlying curve. Scott Rao advocates that the RoR should not increase, especially the "flick" that often occurs just before the onset of the first crack due to the moisture release should be avoided. If we compute the RoR of the RoR we can see the increase or decrease of the RoR signal. Of course computing the RoR of an already noisy signal, like the RoR, will result in a signal with a dramatically noise level. However, if we are just interested to see if that RoRoR (the second-order derivate of underlying temperature curve) is positive (the RoR is rising) or negative (the RoR is falling), we can use this information from the RoRoR to mark the the parts of the RoR where it is rising.
We use the standard formula to compute the RoR, but apply it to the BT RoR signal as already computed (and smoothed somewhat) by Artisan and assigned to the symbolic variable R2.
dR2/dt = ((R2 - R2[-1]) / (t - t[-1])) * pow(10,4)
Note that we multiply not by 60 here, but by 10.000 (10^4) to amplify the signal on the y-axis a lot as we are not interested in the values but just in their sign (positive or negative).

We see peaks in this RoRoR signal (green) where the underlying RoR signal is increasing (gets positive).

Let's trim this signal somewhat. First we remove the peaks of the RoRoR signal where the increase in RoR is minimal like the small peak short before minute 4 in this example. We can do this by clipping all RoRoR values above a certain threshold, let's say 100, to a constant value, say 3000.
dR2/dt = (3000 if (((R2-R2[-1])/(t-t[-1]))*pow(10,4)) > 100 else 0)
Note the use of the conditional operator here.

We can also filter the peak at the begin of the roast where the RoR is still rising as well as the tiny flick at the end of the roast which might be just an artefact of the smoothing algorithm struggling with the signal at DROP.
dR2/dt = (300 if (((R2-R2[-1])/(t-t[-1]))*pow(10,4))>100 and (t>130) and (t < (t{DROP} - 60)) else 0)
Note the reference to the time signal bound to t and the use of the indexed symbolic variable t{DROP} to refer to the time at the DROP event. Because of the conditional added using DROP the RoRoR is always -1 during a roast so the RoR peaks do not show. They don't show after the roast is complete either, until an Update Profile is performed. If you like to see those RoR peaks marked during a roast you should work without this conditional referring to DROP.

Now we are left with the two flicks, each marked by the green curve rising at its begin and falling at its end. Visually more appealing is to use the fill of this curve and hide its actual line. For this we first set the fill of our green RoRoR curve to 10%.


We end up with nice transparent bars that mark the major flicks in our RoR.

Note that this "marking" technique works also during recording. However, it is not very useful to get the flicks marked when they already happen as at that point it is too late to act on them. Moreover, curve fills are not drawn by Artisan during the recording for some technical reasons. Thus one might want to keep the curve lines visible in that case (maybe set to dotted lines).
3.4 Symbolic Formulas and Alarms
The symbolic formulas used to define additional virtual devices can be combined with alarm rules for enhanced automation.
SET BURNER TO 20% ONCE DevRatio REACHES 12%
An alarm action can be used to set the burner to 20% easily, but the current development time ratio (DevRatio) cannot be used directly to trigger such an alarm. As alarms can be trigger based on device data, we can just add a virtual device that provides the current DevRatio via a symbolic formula.
The DevRatio is defined as the length of the last phase w.r.t. to the total roast time in percent. The development time is the time since first-crack start (FCs) and the total roast time is the time since CHARGE. Thus we have
development time: t-t{FCs}
total roast time: t-t{CHARGE}
Thus the DevRatio in percent is defined by
DevRatio: 100 * (t-t{FCs}) / (t-t{CHARGE})

Next we define an alarm that moves the burner slider to 20% once this DevRatio signal reaches 12% after FCs.

See this in action below.

WARN 45sec AROUND FCs
Scott Rao suggests to not change the burner level some seconds before and after the first-crack start (FCs). Also this is not directly possible to model using alarms as we need kind of "forward-looking" alarms for this, based on the prediction of FCs (based on the phases settings and the current temperature and RoR). However, using the symbolic formulas to access the prediction of FCs via the new symbolic variable pFCs this can be modelled. We add a virtual device with the following two signals.
toFCs: pFCs
afterFCs: t-t{FCs}

Next we define two alarms that trigger after DRY. One sets the canvas color to a darker grey once FCs is expected within the next 12s and the other resets the canvas color 12s after FCs based on the readings of our extra device channels. Note that Rao recommends a window of no gas changes of about 45s and we use the 12s here only for demonstration!

See this in action below.

ALARMS TRIGGERED BY BUTTONS
To trigger an action on click of a button one does not need to setup an alarm as buttons can directly invoke actions. However, if one intends to trigger an action some seconds after a button was pressed or as soon as the bean temperature (BT) rose by 10C after the button press, one needs again to combine the power of symbolic formulas and alarms. Say we want to lower the burner by 10% once caramelisation starts and we smell sugar.
Alarms system cannot be triggered by buttons or events directly. Alarms trigger only by time or curve readings. However, button clicks can change event values and event values can be accessed by symbolic variables. Hence, we define a Virtual Device that records event values and then trigger an alarm based on those readings.
Alarms system cannot be triggered by buttons or events directly. Alarms trigger only by time or curve readings. However, button clicks can change event values and event values can be accessed by symbolic variables. Hence, we define a Virtual Device that records event values and then trigger an alarm based on those readings.
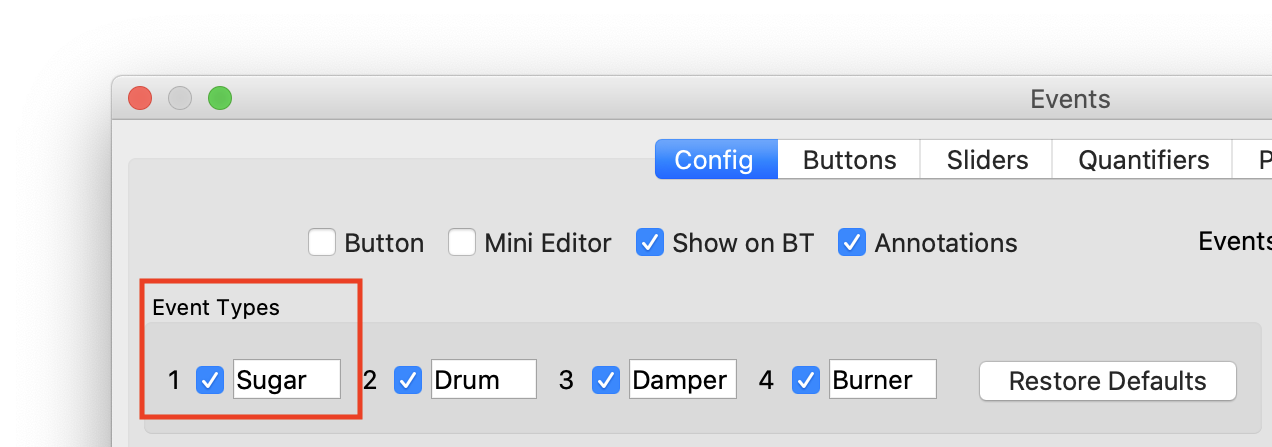
We will use the first event type to capture our sugar event and rename it accordingly in the Events dialog (menu Config >> Events).
Next we define a button "SUGAR" to mark the smell event and sets the sugar event value to 100 (initially it is set to 0). Note that there are already buttons defined to change the burner by +-10%.

Then we define a Virtual Device that records the sugar event (event type 1) to make event value changes accessible to the alarm system. We hide all LCDs and curves of this extra device as it is only for "internal use".

Finally, we define an alarm chain composed of two alarms. The first alarm triggers after DRY as soon as the value of our new virtual device channel exceeds the threshold of 50. The second alarm triggers after the bean temperature (BT) increased by 10C beyond the value observed when the first alarm triggered. Note that putting "From" to "If Alarm" switches both, the time and the temperature criterium to "relative" mode. Time and temperature criteria are now relative to the time and temperatures as observed when the dependent alarm (specified by the number given in the "If Alarm" column) fired. While the first alarm does not fire any action, the second one does trigger the custom button 1, which decreases the burner by 10% (see its definition above).

See this in action below.
