Taking the color of a roast is quite simple nowadays. Just prepare a sample and point your roast color meter at it. The device will display the roast color as a number. This may raise some questions.
- Why do different devices report different results on the same roast?
- What does the reported number mean and how does it compare?
- Why does the same device report different numbers for the same roast?
This post resembles our report
On Idle Noise, where we identified the sources of temperature measuring noise and quantified their impact. This post shares our observations from over 1000 color measurements taken with
Tonino and
Lighttells CM100+ roast color meters. Our results can help answer the above questions and may lead to better color measurements.
1 Background
Let's start with some technical background.
1.1 Why do we care about roast color?
– Morten Münchow
It has been observed that the roast color correlates strongly with the taste of the coffee [1]. As a criterion independent of the roasting process, color readings can help, for example, to transfer roasting profiles from one machine to another or, more generally, to produce a product with a consistent taste.
1.2 What is color?
“A ‘color’ is an interaction between a very small range of
electromagnetic waves and the eyes and brain of a person”
– The Science of Color, TAOS White Paper [2]
Color is the visual perception based on the spectrum of light reflected from an object. This reflection is a composition of light waves with different frequencies that make up this spectrum. When light hits ground coffee, the coffee absorbs some of the light and reflects the rest. Which wavelengths are reflected or absorbed depends on the spectrum of the light source and the chemical compounds in the coffee. For reference, our eyes interpret wavelengths around 640nm as brown, but the intensity of wavelengths in the invisible near-infrared spectrum also change with the degree of roasting.
 |
| Light Spectrum |
1.3 How do roast color meters work?
“What is being measured depends on the illuminant and sensor used”
– Paul Songer [3]
Roast color meters illuminate the presented sample and measure the reflected light energy with their sensor elements. The light spectrum relevant to roast coffee is at the end of the visual spectrum, including the red and near-infrared (NIR). Both, wavelengths of the visible spectrums around 640nm and wavelengths in the NIR spectrum around 880nm seem to correlate well with the degree of roast [4]. To measure the color of the roast, you need a sensor that is sensitive in this range and a corresponding light source. Note that both the power distribution of the illumination source and the sensitivity of the light sensor are typically nonlinear across the spectrum they support.
 |
| White LED spectral power distribution |
 |
| RGBC silicon sensor spectral sensitivity |
There are two broad categories of devices that can be used to read roast color, color meters and color analyzers. A roast color meter is a device that emits light onto a sample and measures the energy of the reflected light using photocells sensitive to a specific bandwidth. To discriminate wavelength, some roast color meters only illuminate the sample within a narrow waveband. Others use a broad spectrum light source but read the reflection with sensor elements that only measure specific wavebands. The
Lighttells combines infrared incandescent bulbs with an infrared sensor, while the
Tonino uses full-spectrum white LEDs, as the
Probat Colorette 4, with a true-color 64-channel photodetector, not covered by an IR filter, to measure red/near-infrared reflectance response. Note that non-LED based illuminants require some warm-up time until they produce a stable spectrum. The
ColorTrack is specific in that it uses a moving laser beam for illumination, pointing to a 1mm² fraction of the sample at each point in time.

Color analyzers such as
Agtron Inc's spectrophotometers, like the M-BASIC device, use optics, often a prism, to separate the reflected light by refraction into narrow bands, which are then measured with photometers. This design results in significantly more expensive devices, but allows for more selective and accurate analysis of the reflected spectrum.
Instruments designed to measure the roast degree of coffee differ in what they measure and how the results are reported.
Why do different devices report different results on the same roast?
Results reported by a device depend largely on its illumination and sensing technology influencing its sensitivity on certain chemical changes. As these differences are highly non-linear, a simple mapping between the results of different device types can not be expected.
What does the reported number mean and how does it compare?
Results are reported according to device specific scales which are in general not well defined (they have no uniform device independent specification). In consequence those numbers hardly compare between different instruments.
1.4 Roast Color Scales
“How the results are reported depends on how the machinery
translates those measurements into a standardized scale”
– Paul Songer [3]
The roast color meter takes the readings captured by its internal sensor and maps them to human-readable numbers. This is like taking all bean temperature readings of a roast profile and map them to one single number to be used to compare roasts. Just the ColorTrack builds a histogram of readings instead of just averaging all results. A color scale is such a mapping defined by a continuous function such that the resulting values decrease (or increase) with the degree of the roast. A number of different color scales are in use today. The most popular one, and the one featured by SCA, is the Agtron (Gourmet) scale (0-100). It is designed to return 0 for carbonized coffee and 100 for "under-developed". Other more well-known roast color scales are the Agtron Commercial scale (0-75), the ColorTrack scale (100-0), the
Neotec ColorTest scale (0-200), the
Probat's Colorette scale (0-200) and the Tonino -Scale (50 -130).
Color scales are tied to a specific device and come without any device independent formal definition. This complicates the translation of readings between different scales. Even roast color meters that report their results using the same scale (often Agtron) can report different results due to differences in the implemented illumination and sensor technology, covering different ranges of the frequency spectrum. Color scales differ in resolution. A 10 point difference on the Agtron scale could correspond to a 16 point difference on the higher resolution Tonino scale, or just a 3 point difference on the Agtron Commercial scale.
Color readings w.r.t. multiple scales can be used to calculate mappings between those scales. For example,
Rob Hoos took measurements on a number of samples using two devices [5]. A Lighttells CM100 reporting in Agtron and a
Roast Vision meter reporting on a different scale. From these measurements he calculated linear mappings, functions of the form
y=ax+b, which allows Roast Vision values to be approximated from Agtron readings and the other way around. Rob calculated the constants
a and
b through mathematical regression minimizing the total error. The measure
R2 indicates the quality of the approximation in a range from 0 to 1, where 1 denotes the perfect approximation.
 |
| RoastVision to Agtron mapping by Rob Hoos [5] (reconstructed using WebPlotDigitizer) |
1.5 Roast Classification
“The entire idea of communicating roast color by numbers
is thoroughly confusing to customers.”
– Kenneth Davids [6]
Before the availability of roast color meters roast degrees were communicated using terms like "French", "Turkish", "Dark", "Full City", "City", "Light", "American" and "Cinnamon". As with the roast numbers reported by roast color meter, these terms are not well defined and/or their definition, which varies from region to region, are in part based on historic confusions [6]. Today most of the more romantic names have disappeared and only the abstract terms "Dark", "Medium-Dark", "Medium", "Medium-Light" and "Light" are used to give consumers an idea on what to expect from a bag of coffee. The Agtron manual [7] defines a mapping from the Agtron scale into this coarse roast classification system aligned with the SCA color disk system.
1.6 Alternatives
“Ultimately it is the ground roast score that should be
the focus of controlling product consistency.”
– Agtron M-Basic II manual [7]
Instead of using a roast color meter, one can visually compare roasted coffee to previous roast samples or to printed color tiles. Aside from the fact that coffee, as a natural product, degrades over time and differences in surface reflectance can make printed tiles difficult to compare, our eyes' color perception and resolution is limited and varies from person to person. According to the Agtron M-Basic II manual [7], the visual resolution of our eyes with medium roasts is only around +-6 Agtron points.
2 Precision & Accuracy
“..comparing our readings to those generated by another Agtron instrument
in another location? The results are considerably less consistent
(although still much better than staring at the beans and guessing).”
– Kenneth Davids [6]
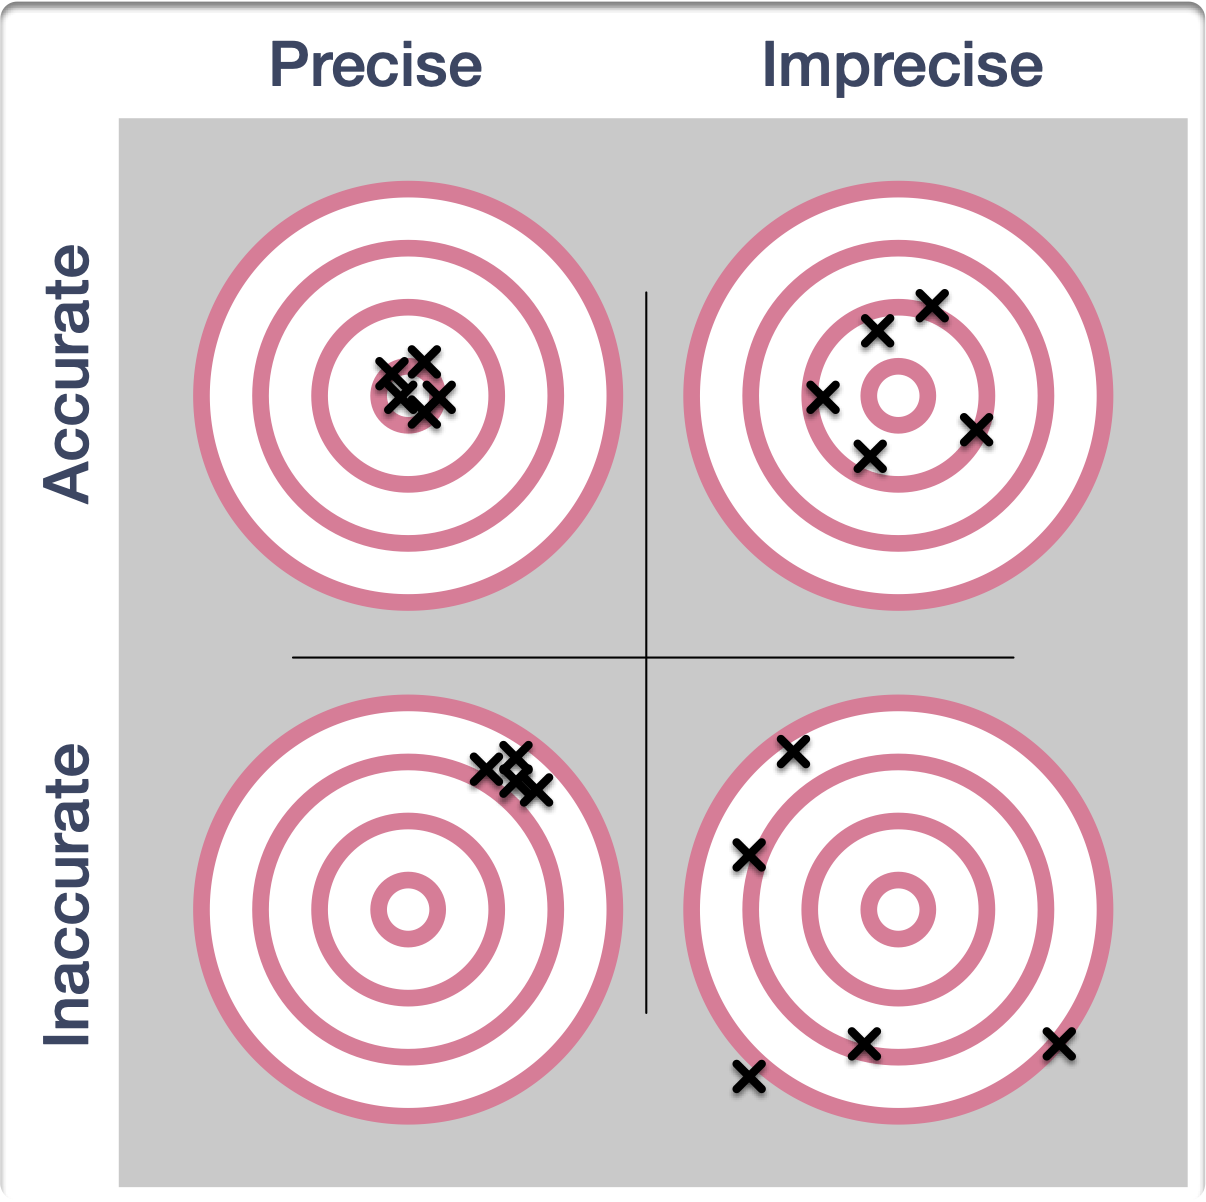
To understand how to best interpret and improve on the variations of the measurement results we get on taking several readings we have to distinguish between precision and accuracy.
- Precision: How close are the measurements of the same coffee to each other?
- Accuracy: How close are the measurements to the true or accepted value?

Accuracy is difficult to define in our context as it is not obvious what the accepted value should be. The popularity of the Agtron scale in coffee suggest to take Agtron readings as accepted values. Considering the discussion in the previous section one should measure those accepted readings with a Agtron device equipped with that specific Agtron sensor technology. Note that even picking an Agtron device can be problematic due to inter-instrument variance within and across one series. For example, the M-BASIC II comes with "improved linearity" and uses a different (now solid-state based) NIR illumination which reduces the warm-up period from 24h to just 30 minutes compared to the original M-BASIC. At least “one of the design priorities of the M-BASIC II was to improve the analyzer to analyzer agreement within the M-BASIC II family and over indefinite periods” [7]. So not all Agtron devices are equally good references for the Agtron scale?
Let's turn first to the aspect of precision, which seems to be simpler to grasp. Precision is influenced by signal noise of the device itself as well as the consistency of the sample.
2.1 Device Precision
Most devices on the market today use silicon-based sensors which are known to be affected by operating temperature. To compensate for room temperature fluctuations most devices allow users to conduct a one or two point device calibration.
As with any digital sensor application, the measuring results suffer form noise. Sensor noise as well as digital noise stemming from quantification effects. The average sample
standard deviation (STDEV) from taking 832 readings with 4 Toninos and 208 readings with one Lighttells CM100+ from 13 sample coffees with 4 replicates each, calculated to 0,22 Tonino points (about 0,18 Agtron points) for the Tonino and 0,1 Agtron points for the Lighttells. The STDEV was calculated separately for measurements of the same sample from the same replicate (per sample preparation) and then averaged. While the Lighttells observed the exact sample surface on all measurements, the Tonino was repositioned on the same sample observing a slightly different surface on each measurement. Without repositioning of the Tonino its average STDEV calculated well below 0,1 point on the Tonino scale, and thus well below 0,1 on the Agtron scale. This can easily be duplicated by putting a Tonino on a sample and using the
open-source Tonino app to measure a number of readings. The app computes the sample STDEV of all selected readings (in the screen shot below the STDEV of 12 readings is just 0,02).

We conclude that the device precision of those two properly calibrated color meter is extremely high and the remaining measuring noise is negligible. We assume this holds for other meters as well. There must be other explanations for the observed fluctuations in the measuring results of color meters.
2.2 Sample Preparation
To obtain precise color analysis results, correct sample preparation is extremely important [3]. The intensity of the reflection from a sample follows the
law of the inverse-square law of light which states that the intensity of non-parallel light is inversely proportional to the square of the distance from the light source as it spreads out. Note that this effect is smaller for the parallelized light of a laser beam. Thus the light energy reflected directly from the sample surface has the greatest influence on the measuring result. The indirectly reflected light, which travels longer distances, has only minor contributions. As color meters essentially measure the energy of reflected light, their design typically ensures that the distance between the sensor and the samples surface is kept constant.
Particle Size
The amount of light reflected from a perfectly flat surface is significantly greater than that of a rough one. Therefore the readings a color meter delivers with fine grounds are higher than on coarser grounds of the same coffee. In [8] it is reported that
“[a] sample prepared at 200µm can deviate 10 units (about 25%) from the sample prepared at 1200µm” without specifying the scale of the unit nor the reference for the percentage. We measured the readings of a relatively dark roasted coffee that was sieved to different particle sizes measured using a
Lighttells CM100+ reporting in Agtron as follows. Comparable results were obtained using a
Tonino.
- 63,2 @ 1100 – 1400µm
- 65,0 @ 800 – 1100µm
- 67,9 @ 500 – 800µm
- 85,2 @ <500µm
The color difference can be seen with the naked eye (coarsest particles in the upper left corner, finest particles in the lower right corner) and is related to the increase in the direct reflecting surface area of finer grinds.
These results suggest that one should keep the grind size constant to get comparable color readings. Unfortunately, this does not completely solve the problem, as the particle size distribution produced by a grinder changes with the roast degree [9] as shown by the graphic below (reproduced with the author's permission).
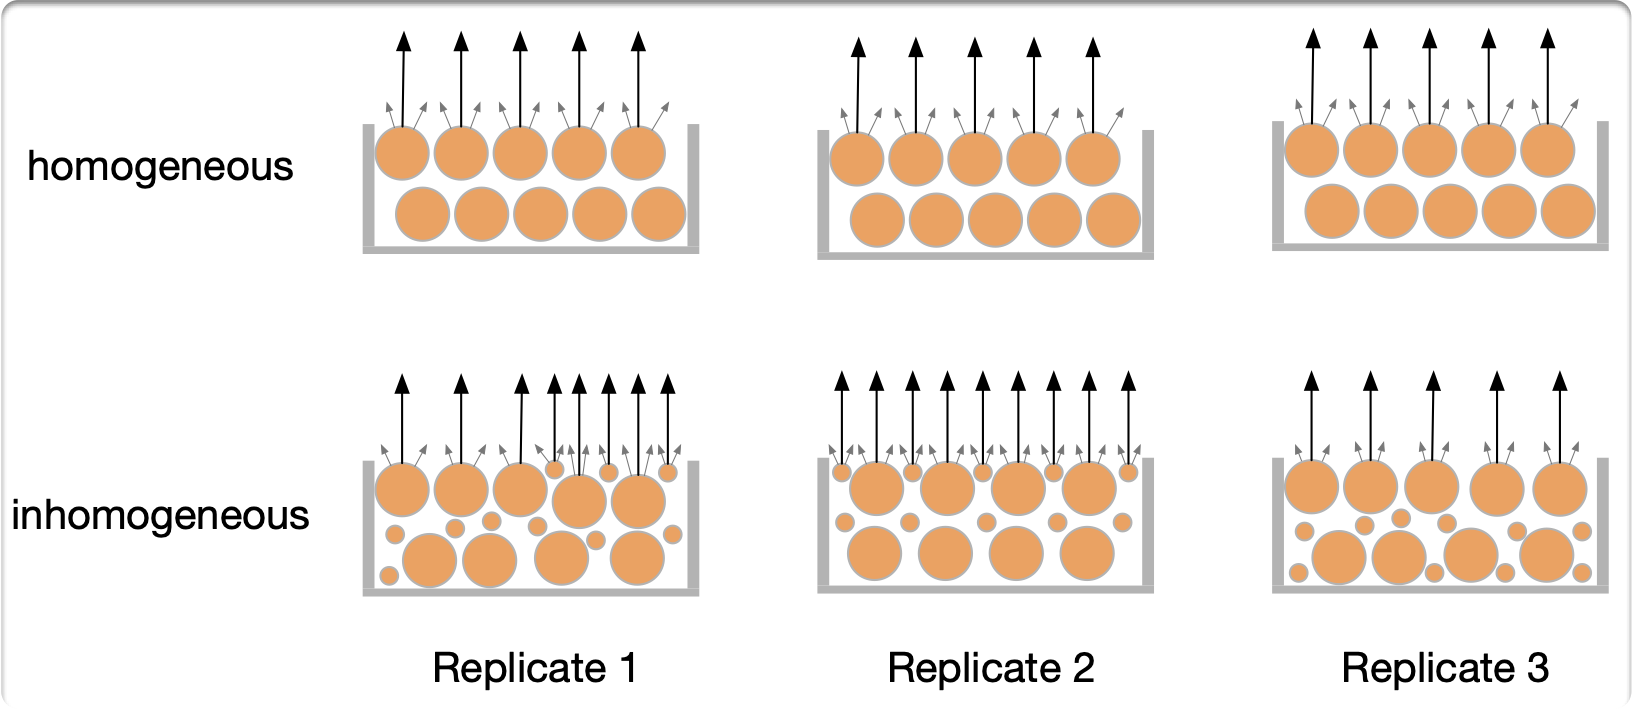
This suggests that samples should be sieved prior to taking color readings. Not only does sieving increase comparability between readings, but a narrow particle size range also increases the precision and repeatability of the measurements due to the increased sample homogeneity. Note that preparing samples with finer particles offer a larger reflecting surface per area. Using smaller particles make it more difficult to prepare an even sample surface by leveling. Tamping, however, increases the surface per area further and is always possible.
In preparing 6 replicants for each of two coffees ground to a particle distribution peak within 800-1100µm we measured variations with an average STDEV of 0,88 Agtron using the Lighttells CM100+. Note that this number includes the 0.1 Agtron average STDEV variation added by the device sensor noise as noted above. Sieving to 800-1100µm halved the average STDEV between readings of those replicates to just 0,45 Agtron.
An additional positive side effect of sieving, especially to smaller particle sizes, is that this method leaves less chaff in the sample, which can easily falsify color readings.
Note that the uneven surface of whole beans makes whole bean colors measured by most color meters questionable. The only exception seems to be the ColorTrack device which is claimed to be less affected by particle size. This is most likely because the tiny illuminated surface area per reading, not optically averaging the reflection answer from a larger area, but instead creating histograms of the resulting measurements.
Decomposition
Once coffee gets out of the roasting machine and cools, it begins to decompose. As it decomposes, roasted coffee darkens. According to the Agtron M-Basic II manual [7] “decomposition can lower a samples color measurement result by up to 3 points on the Agtron scale in 24 hours”.
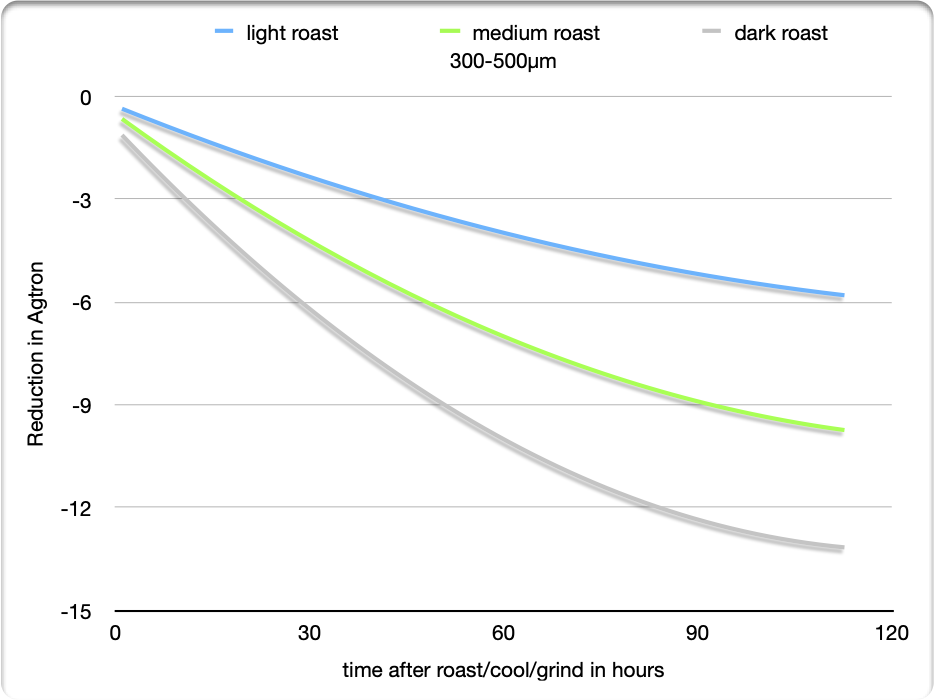
We compared the influence of roast degree differences to the rate of decomposition and found that darker roasts darken faster than lighter roasts. The samples of ground coffee were sieved to 300-500μm and tamped into espresso baskets. We prepared samples right after the beans were cooled after roasting. We kept measuring the same samples using the
Tonino (reporting in Agtron) over several days to quantify this effect.
Likewise, finer grinds darken faster than coarser grinds. We assume, but did not verify, that the rate of decomposition varies with difficult-to-control environmental factors such as the amount of oxygen available, temperature, humidity.
We recommend preparing the samples by grinding, sieving and leveling/tamping immediately after the roast cooled to room temperature so that color readings are always taking from the roast at the same time and temperature to make them comparable.
2.3 Device Accuracy
As with all laboratory methods, instrument calibration affects instrument accuracy. Results from silicon-based sensor elements are influenced by fluctuations in room temperature and the performance of lighting sources can change with aging. Most instruments come with a calibration pad or two that allow the user to recalibrate the instrument to compensate for these effects.
Even perfectly user-calibrated devices of the same type can suffer from differences between devices caused by variations in components, design changes, and general design limitations. This has been reported even for very expensive devices and can add an offset of one to two points on the Agtron scale between devices.
Finally, the accuracy of different device models, possibly from different vendors, is relative to a "standard" scale like Agtron, which is limited by the quality of the underlying mapping between internal readings and the corresponding values on the approximated scale.
Comparing Color Meters
Three people operated the devices according to the corresponding devices protocol. Each subject measured the whole beans and ground color of five coffees roasted to different degrees using each instrument. It is not documented if the reported readings are the result of averaging measurements of several replicates or just from one measurement. There are in total 15 whole and 15 ground color readings for each device. Note that the grounds where not sieved, but the grind setting was kept constant. The particle distribution was not measured, but can be assumed to be relatively wide and most likely not constant for the five very different roast levels.
To estimate the precision of the participating devices we averaged the STDEVs of all measurements taken per device on ground as well as whole beans, also reporting the results for the RoastRite but not counting them in the average. The RoastRite results are given without decimals and thus its readings are not as precise as the ones of the other devices which turns the comparison unfair.
As expected, the variation was, on average, about twice as high for whole beans as for ground beans and about the same across devices for ground beans. The larger differences between the results across instruments for whole beans are most likely due to the relatively small sample.
The data set shows that the differences on measuring ground bean color with respect to the readings of the original Agtron M-Basic II can be more than 2 points.
 |
| Accuracy – ground beans |
On average, the deviation for ground beans calculates to only 1,1 point. Measuring the color of whole beans resulted in a deviation about twice as large.
Note that these deviations from the Agtron reference readings include the variations caused by instrument noise as well as the variations caused by sampling. The remainder of the deviation is most likely caused by differences in the measured wavelength range or other constructive differences between the devices like the applied mapping from internal to Agtron readings.
2.3 Building an Agtron Scale for Tonino
One criticism sometimes leveled at our
Tonino roast color meter is that it doesn't report Agtron readings. We usually refer to our
open source Tonino app which makes it easy to construct and establish a mapping into any value range including Agtron. This only requires a certain number of readings with known Agtron target values.
 |
| Open-source Tonino app constructing a mapping |
Motivated by the report by Rob Hoss [5], we decided to develop a sample Agtron scale for the Tonino, although we were aware of the known accuracy issues even between Agtron devices.
For lack of access to an Agtron reader we used a Lighttells CM100+ to provide the Agtron reference values. We ensured that the Tonino measurements and the CM100+ measurements were performed with the utmost precision using the learnings discussed above. In conducting this experiment, we took the opportunity to calculate performance indicators of both devices as reported below.
Setup
We roasted 13 batches of different coffees to roast levels across the entire roast spectrum. We ground approx. 150g from each batch. According to the device instructions, we sieved the part to be analyzed by the Tonino to the range of 300-500 µm and the other part to be analyzed by the Lighttells to 800-1100 µm corresponding roughly to the core range recommended for the Agtron M-Basic/II [7]. Note that Lighttells CM100+ manual does not propose a specific particle size distribution.
Note that the decomposition effects are not relevant to create the mapping. All instruments analyzed the samples in the same state of decomposition, i.e. at the same time after roasting and grinding.
To also get data on the variations between the instruments of the same type, we carried out the experiment with 4 different Toninos. However, we only had one Lighttells CM100+ available, so we didn't get results on inter-instrument variation for this type of instrument. All devices were calibrated once according to the manufacturer's instructions prior to the experiment.
Process
From each ground and sifted coffee we leveled and tamped 14g into a standard espresso basket and took 4 measurements, repositioned, using each of the 4 Toninos on the same prepared sample. We repeated this process four times using the same sifted coffee, which allowed us to estimate the variations caused by the sample preparation itself. This way we got 4 replicates for each of the 4 Toninos with 4 measurements from each, resulting in a total of 64 readings per coffee. Note that the Tonino readings were taken using the Tonino app, which registers the readings to its full internal accuracy of 10 decimal places.
Similarly, we leveled about 30g of the ground and sifted coffee into the Lighttells sample container and took 4 measurements of each sample, rotating the device 90° after each measurement. Again, we repeated this process 4 times using the same grounds, resulting in 4 repetitions of 4 measurements each, resulting in a total of 16 readings per coffee.
Results
Computing the mapping between the 13 averaged Tonino values and the corresponding 13 averaged Agtron reference values by linear regression resulted in a good quality mapping with R2 = 0,965.
Examination of the deviations of the mapped readings from the reference values show that the relation for lighter roasts is quadratic rather than linear. A quadratic mapping reduces the total error considerably (R2 = 0,99).
A cubic mapping allows darker roast colors to be mapped almost linearly, while the mapping for lighter roasts remains square. This further minimizes the overall error and provides a near-optimal mapping (R2 = 0,999).
This Agtron mapping for the
Tonino is now distributed with the
Tonino app and included in the latest Tonino firmware. Note that the accuracy achievable by applying this mapping depends on proper sample preparation, which has to include sifting to the corresponding tight ranges used on construction of this mapping, and does provide only "Lighttells CM100+"-Agtron readings.
The inter-device accuracy of the Tonino, taken as the average STDEV over the readings of the 4 units measuring the same replicates, calculated to 0,6 – 2,0 Agtron (dark roasts to light roasts). Note that the deviations measured were not constant and not even linear across the roast color range due to the cubic mapping applied. A comparison of 4 devices is certainly not enough to get stable results, but one can get a first impression of the magnitude to be expected. Inter-device variations can be greatly improved by applying device-specific device to device mappings.
Why do different devices report different results on the same roast?
In case devices report according to the same scale (e.g. Agtron) accuracy depends on proper device calibration and suffers from subtle differences of their components and the quality of mapping internal readings to values displayed to the user.
Why does the same device report different numbers for the same roast?
This is mainly caused by variations in the presented sample itself and dominated by effects of inhomogeneous matter with wide particle size distributions, changes by decomposition as well as inconsistent sample preparation in general. Additionally, coffee is a natural material which never roasts completely even to a homogeneous roast degree. Thus variations on reading multiple replicates is to be expected.
3 Summary and Suggestions
“Reading the color of ground coffee is tricky.
Reading the color of whole beans is questionable!”
– Marko Luther
What amount of variation is to be expected and what contributes most?
a) Device Noise (~0,1 Agtron STDEV)
Device noise is negligible and does not influence device precision much. Source are:
- type of sensor and illumination source
- device geometry (distance subject-sensor, observed reflecting surface area, ...)
- electronic design (analog-digital converter resolution, ..)
- electric power source and stabilization
b) Inter-Device Accuracy, same device model (<2 Agtron STDEV for the Tonino)
Inter-device accuracy is only relevant on comparing readings across device. Sources are:
- subtle differences of components (sensor, illumination, casing, ...)
- device calibration
c) Inter-Device Accuracy, different device models or manufacturers (>2 Agtron STDEV or more)
Accuracy between devices of different models is in general worse than between devices of the same model type and again is only relevant when readings of the exact same samples are compared. Sources are:
- accuracy and quality of color scale mapping
- constructional differences (illumination wavelength range, observed wavelength spectrum, device geometry, ...)
d) Sample Preparation (0,5 to 1,0 Agtron STDEV with careful and consistent preparation and >2,0 Agtron STDEV otherwise)
Sample preparation has a major impact on the precision of roast color readings. Sources are:
- time after roasting and grinding (decomposition changes roast color significantly!)
- environmental conditions
- grind size and particle distribution
- roast degree
- surface preparation
- sample contamination (chaff, ...)
- homogeneity of the raw coffee and the roast
How to get best results?
- take the readings within the first hour out of the roast after cooling the beans to room temperature
- sift the ground beans to limit their particle size distribution
- 300–500µm for the Tonino
- 800–110µm for the Lighttells, RoastVision, Agtron, ...
- prepare samples always strictly the same way following the recommendations of the device manufacturer
- take the average/median of readings from 3-5 samples or apply a more formal Variation Analysis to achieve sufficiently narrow confidence intervals
Don't get unsettled if you get slightly different readings from your meter for the same roast and prepare your samples well.
Note that this post has not received formal scientific review and therefore what is reported here should be considered observation and opinion.
Marko
DISCLOSURE: Marko Luther, the author of this post, is the co-developer and manufacturer of the Tonino color meter.
References
[6] Davids K.:
Saying Coffee - the naming revolution.
Roast Magazine, Nov/Dec (2010)
[7]
AGTRON Inc.:
AGTRON M-BASIC/II Coffee roast analyzer operation manual (2020)
[8] Hallien, C.:
Demystifying Roast Analysis - Colorimeters Versus Spectrometers. Roast Magazine, Mar/Apr (2019)
[9] Kornman, C. and Becker, E.:
Grinder Alignment: An Exploration of Consistency, Cupping Settings, and the Impact of Roast Degree. Roast Magazine, Jun/Jul (2021)
[10] daVinci Coffee:
Comparing brands of Roast Analyzer.
C³ Coffee Magazine, Vol. 11, pp. 102 (2018)